Step 2c: Hardware - LCD
The code for this step is found here.
In addition to eventually sending sensor readings back to the host, we want to use the LCD to show the current values. We'll divide the display into three parts. The top row will show the sensor readings as text. The bottom row will have graph logged values over time. The left graph will contain humidity values, the right temperature.
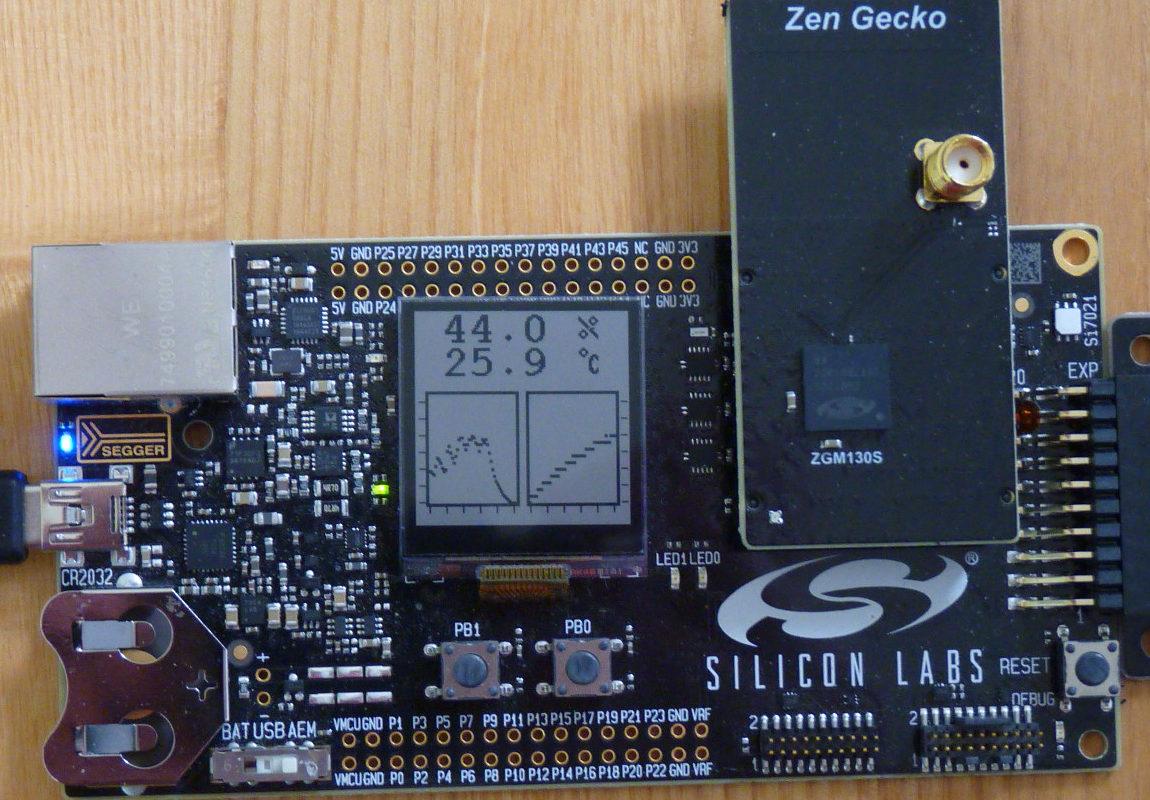
The DevKit LCD after a log, showing the current readings (top) and graphs of the humidity (below left) and temperature (below right). The sensor is the white square at the top right of the board.
The ZWave SDK provides most, but not all, the files we need to operate the device. There are two headers, one with the display configuration and one with error codes, that are found only in the Gecko SDK. We can use the standard low-level display drivers for the hardware, but will need to modify the text display code to use a font with new characters and will need to write code to display graphs.
To start with the text display,
-
Copy ${SDK}/hardware/kit/drivers/displayfont16x20.h to hw/displayfont16x20HT.h and add/change the four characters we need.
-
Copy ${SDK}/hardware/kit/common/drivers/textdisplay.c to hw/, add references to the new font, and edit TEXTDISPLAY_New() and TextdisplayUpdate() to allow for fewer text lines to make room for the graph.
-
Copy ${SDK}/hardware/kit/common/drivers/textdisplay.h to hw/ and add a member maxlines to the TEXTDISPLAY_Config_t structure.
-
Copy gecko_sdk_suite/v2.4/util/silicon_labs/silabs_core/graphics/displayconfigapp.h to hw/ and add defines for the new font and to allow VT100 escape codes.
-
Copy gecko_sdk_suite/v2.4/platform/middleware/glib/em_types.h into hw/.
We need to add four symbols to the font: '-', '.', '%', and degree-C. They need to be in a continuous ASCII series with the other characters, so we put the first three at the start with % replacing the slash (we will have to print a '/' to get the percent, in other words). The degrees sign replaces the semicolon as the next-to-last character, before the space. The characters are bit encoded and were hand-crafted in a spreadsheet and had to be flipped left-right for display. The top of source file #2 defines FONT_ASCII_START, FONT_CHARACTERS, FONT_BITS_MASK, FONT_BITS_LOG2, and fontBits to describe the new font. The ZWave SDK doesn't contain all the code needed to use the LCD for this devkit, which we find in the Gecko SDK. To displayconfigapp.h add defines for INCLUDE_TEXTDISPLAY_SUPPORT, TEXTDISPLAY_NUMBER_FONT_16x20HT, and INCLUDE_VIDEO_TERMINAL_ESCAPE_SEQUENCE_SUPPORT, and remove or comment out the real time clock section at the bottom.
To compile we must
-
Link ${SDK}/hardware/kit/common/drivers/display.c under hw/.
-
Link ${SDK}/hardware/kit/common/drivers/displayls013b7dh03.c under hw/.
-
Link ${SDK}/hardware/kit/common/drivers/displaypalemlib.c under hw/.
-
Add ${SDK}/hardware/kit/common/bsp to the C/C++ Include list.
-
Link ${SDK}/platform/emlib/src/em_prs.c under hw/.
We are now ready to display the sensor values in display_humidity() or display_temperature(). We use VT100 escape codes to get to the right line and print values digit by digit, dropping leading zeroes, adding a decimal point when appropriate, and finishing with a space and the units. There are separate routines for humidity and temperature since the initial positions are different and we must handle negative temperatures. Escape codes are written to screen with TEXTDISPLAY_WriteString(), characters with TEXTDISPLAY_WriteChar(). You'll find the escape codes defined in textdisplay.h. Note that we send '/' or ';' for the units, per our font substitution.
The driver function DISPLAY_Init() replaces the GPIO pin setup we had to do in Step 2b, and we no longer need to use the software timer to drive the EXTCOMIN pin. We create the appconfig structure to store the display configuration in a global variable which is passed to each TEXTDISPLAY_* function, and replace the setup_lcd() function in Step 2b with setup_display(). This must be called before setup_i2c() because it enables GPIO pin 15, the display and the sensor.
In our event handler we display the sensor reading after printing it to the UART console.
Our graphics driver will be modeled on textdisplay.c. The public interface will include GRAPHDISPLAY_New() to set up the geometry of the area and draw boxes around the graphs, GRAPHDISPLAY_Delete() to release any resources we've reserved, GRAPHDISPLAY_Clear() to turn off all the pixels inside the frame (remembering that the display is inverted, or black-on-white, so 'off' really means 'white' and is a set bit), GRAPHDISPLAY_GetWidth() to get the size of the drawing area, and GRAPHDISPLAY_SetPoint() to turn a pixel on or off. For batch changes, the drawing functions have a redraw argument that if false sets pixels in the backing store without sending the whole store to the display. Only for the last point should redraw be set true. Pixels are bit-packed into the store. The workhorse function underneath this code is pPixelMatrixDraw(), part of the displayls013b7dh03.c code. The driver is in graphdisplay.c, the header is graphdisplay.h, and both are in the hw/ directory.
Clearing the text, which sets the update mode to TEXTDISPLAY_UPDATE_MODE_FULL, erases the entire display, so we need to modify the text display so it thinks there are fewer lines on the LCD than there really are. We add a member maxlines to the display configuration structure to provide the limit (0 will still use the entire screen), setting it before calling TEXTDISPLAY_New(). The driver will work without changes with the overridden line count, except for one edit to TextdisplayUpdate to keep the default behavior of clearing the bottom of the screen automatically when we haven't set maxlines.
We need to re-organize the sensor log before we can graph the data. We gather the history of the measurements in the htsamples structure, also using it to track the range of values, position in the graph, and the sampling time and count. We don't want to use a fixed range for graphing so we can adapt to the readings, be they fairly stable over a short run or with large swings over a longer. We add two functions: clear_log() to initialize everything, and start_sampling() to prepare the log and graphs and start the timer. We change the timer callback to store the readings in the structure, updating the range in the processs, and displaying/graphing the point. Remember this callback no longer contains the LCD EXTCOMIN toggle. We use separate functions to graph each value (with some work we could abstract the log so we would need only one function, because the two are mostly the same). If the vertical scale changes we must clear the graph and redraw all points, otherwise we can just plot the new point. The logic is straightforward within each function.
Our application now contains these new or modified functions. The I2C and ZAF functions setup_i2c(), i2c_strerror(), verify_sensor(), read_HT(), handle_dummy(), ApplicationInit(), ApplicationTask(), and Transport_ApplicationCommandHandlerEx() are unchanged.
|
function |
role |
description |
|
handle_event |
button press |
read sensor or start logging |
|
start_sampling |
logger |
clear log/graph, start timer |
|
sample_ht |
logger |
store and display/graph sensor values |
|
clear_log |
logger |
prepare data store for logging |
|
setup_display |
LCD driver |
initialize text, graph displays |
|
display_humidity |
LCD driver |
show humidity in text display |
|
display_temperature |
LCD driver |
show temperature in text display |
|
clear_graphs |
LCD driver |
erase data from graph display |
|
graph_humidity |
LCD driver |
draw humidity log in graph |
|
graph_temperature |
LCD driver |
draw temperature log in graph |
|
draw_2x2point |
LCD driver |
draw 2x2 point in a graph |
We've had to add many files to the hardware directory.
|
hw/ |
src/ |
ZAF_AppUtil/ |
ZAF_CC/ |
|
displayconfigapp.h |
config_app.h |
ZAF_TSE.c |
|
|
displayfont16x20HT.h |
HTSensor1.c |
ZW_TransportEndpoint.c |
|
|
em_types.h |
i2cspmconfig.h |
|
|
|
graphdisplay.c |
|
|
|
|
graphdisplay.h |
|
|
|
|
textdisplay.c |
|
|
|
|
testdisplayconfig.h |
|
|
|
|
textdisplay.h |
|
|
|
|
linked within Simplicity Studio |
|||
|
display.c |
|
application_properties.c |
|
|
displayls013b7dh03.c |
|
AppTimer.c |
|
|
displaypalemlib.c |
|
board_indicator.c |
|
|
em_i2c.c |
|
board.c |
|
|
em_letimer.c |
|
ZAF_command_class_utils.c |
|
|
em_prs.c |
|
zaf_event_helper.c |
|
|
gpiointerrupts.c |
|
ZAF_uart_utils.c |
|
|
i2cspm.c |
|
ZW_TransportMulticast.c |
|
|
startup_zgm13.S |
|
ZW_TransportSecProtocol.c |
|
|
system_zgm13.c |
|
|
|
The picture at the start of this section shows the display after a logging session. We've implemented all the hardware functions we wanted, so it's time to turn to ZWave.